
Reading the Dashboard
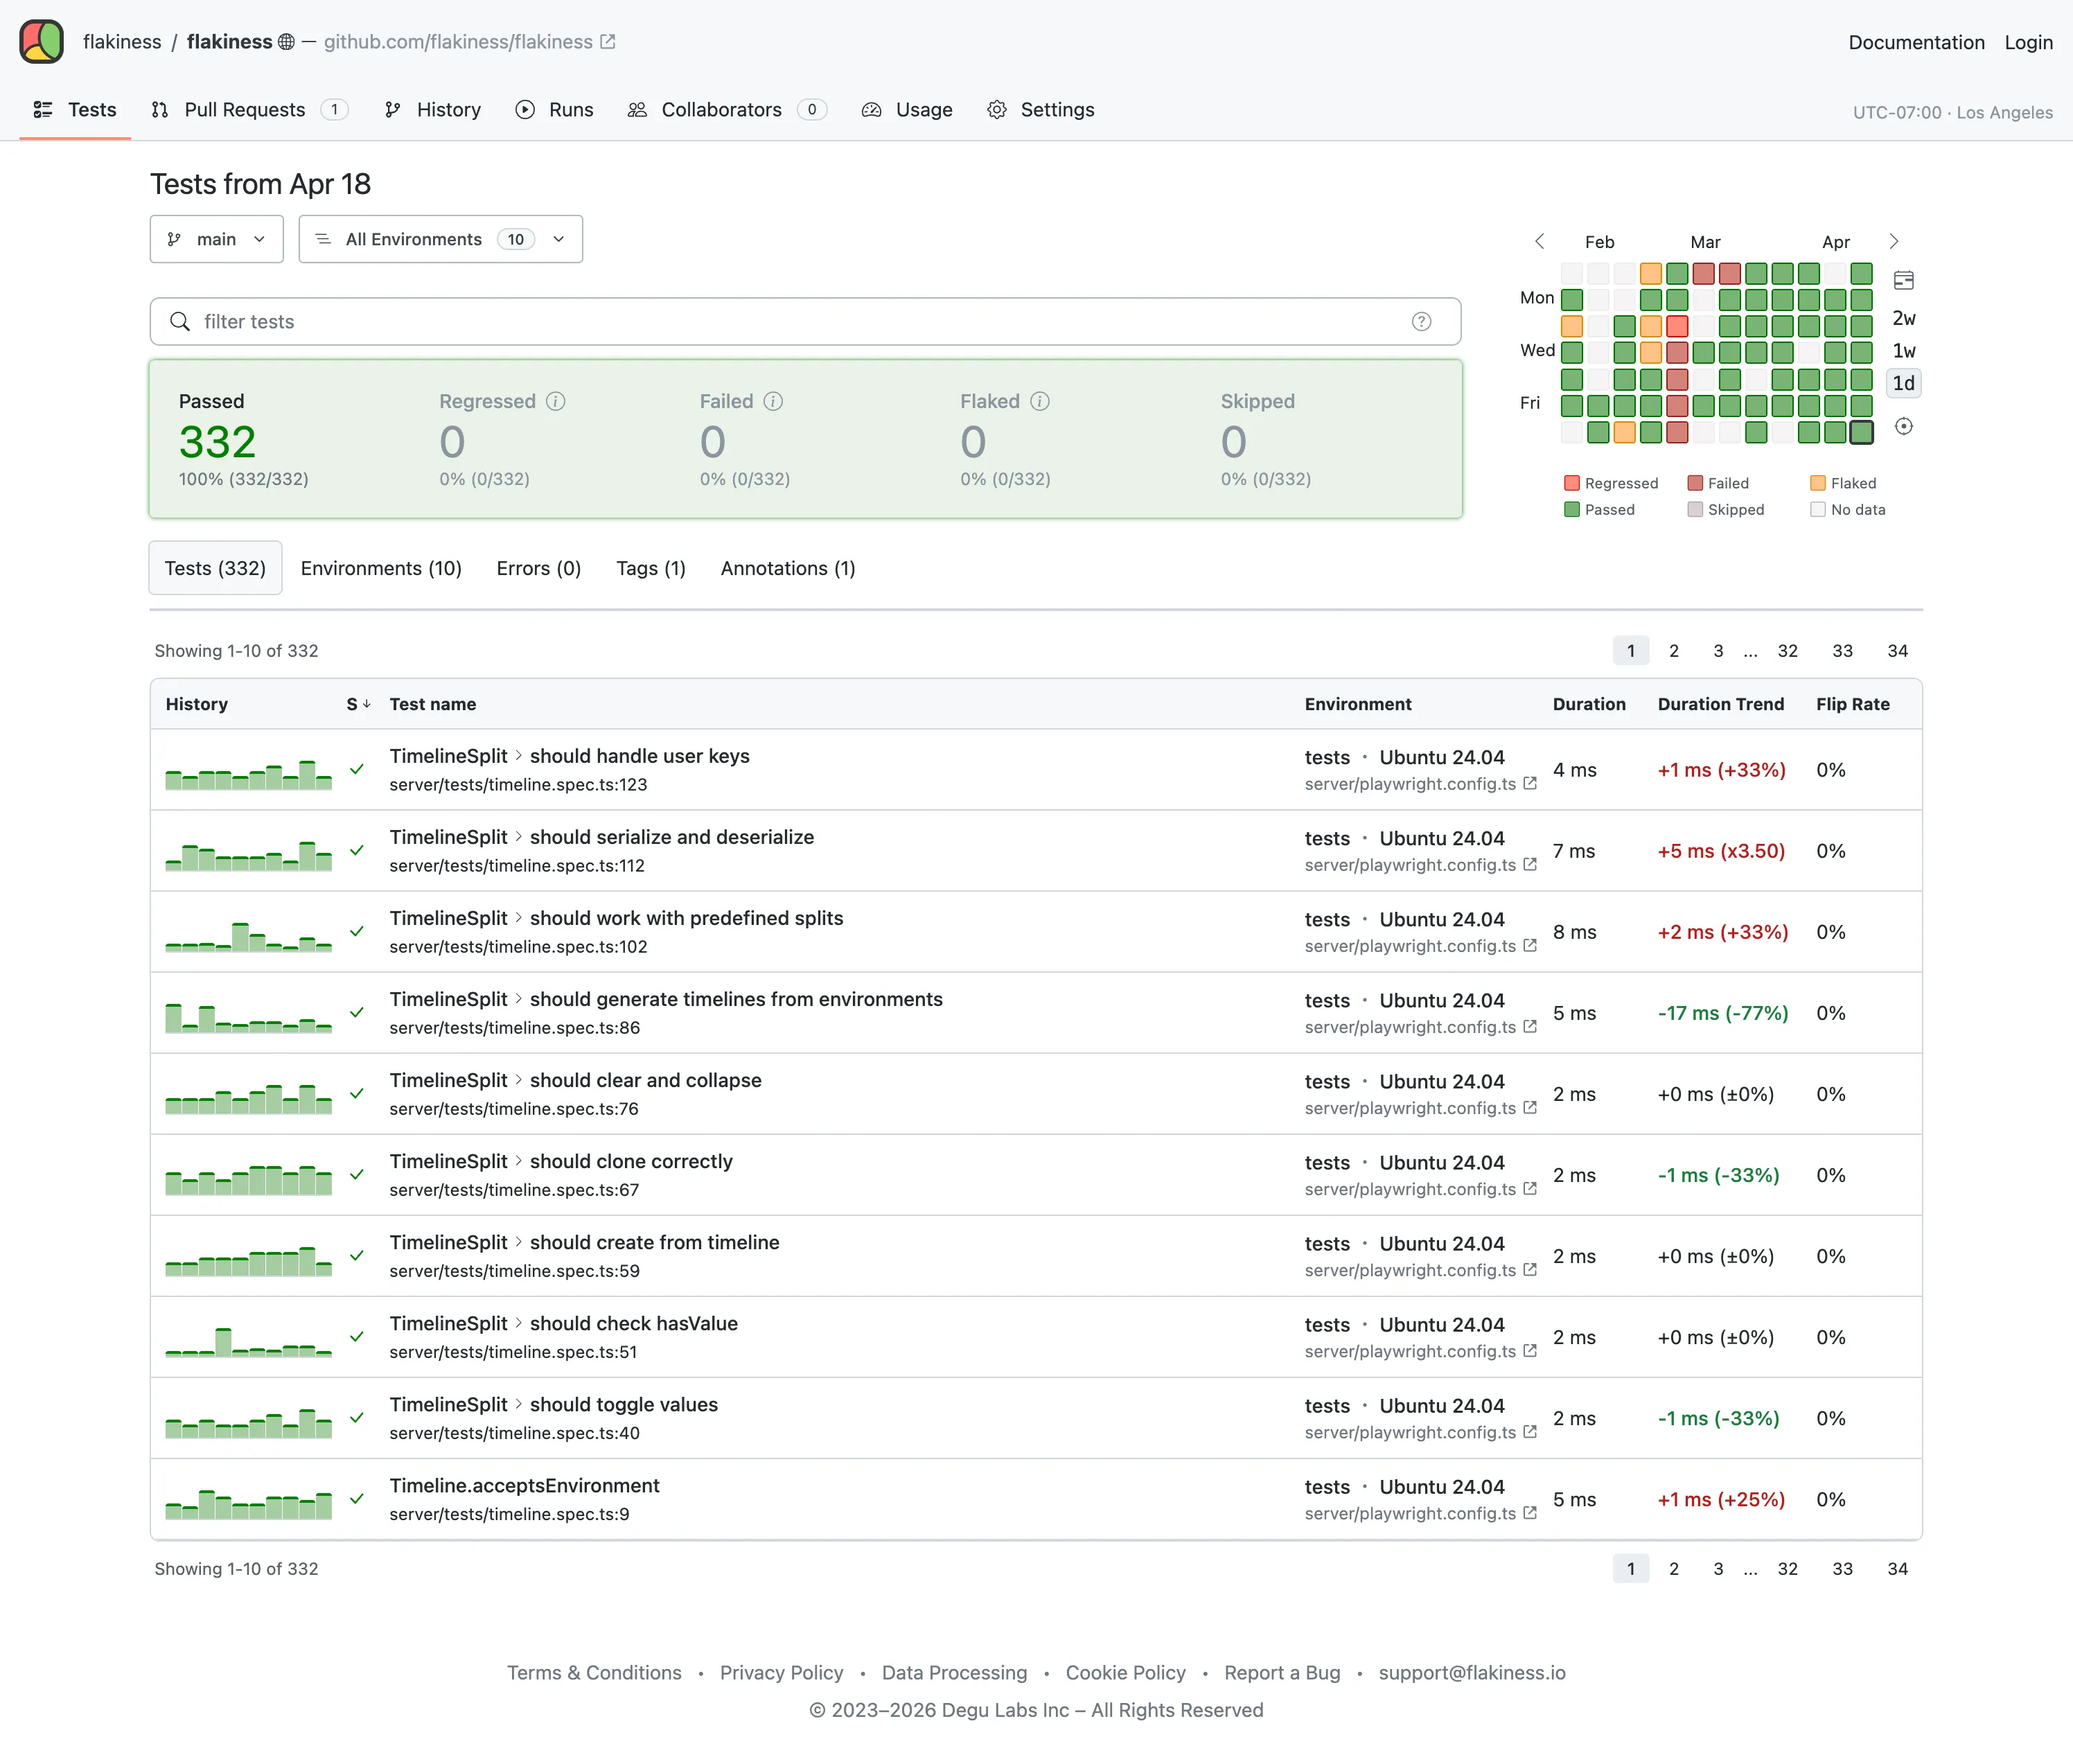
When you navigate to a project’s test page, flakiness.io shows you the default test report. This is an aggregated status view across all environments and all tests of the project’s default branch, for a single day – the day of the last commit, in the project’s timezone.
The default test report is also what powers other features:
- Project badges reflect the status from the default test report.
- Slack notifications are triggered based on changes in the default test report.
Once on this page, you can navigate to a different day, environment, or branch.
Hover or click a numbered region on the screenshot to jump to its explanation, or use the “On this page” outline on the right.
Branch selector
Section titled “Branch selector”Defaults to the repository’s main branch and lets you switch to any other branch. The branch defines the history window used throughout the dashboard; all testing data is scoped to the selected branch.
Scoping results to a single branch is essential to keep statistics and health signals unaffected by on-going development and testing on other branches. For example, a test that passes on main but fails on a feature branch is a regression on that branch, but not on main.
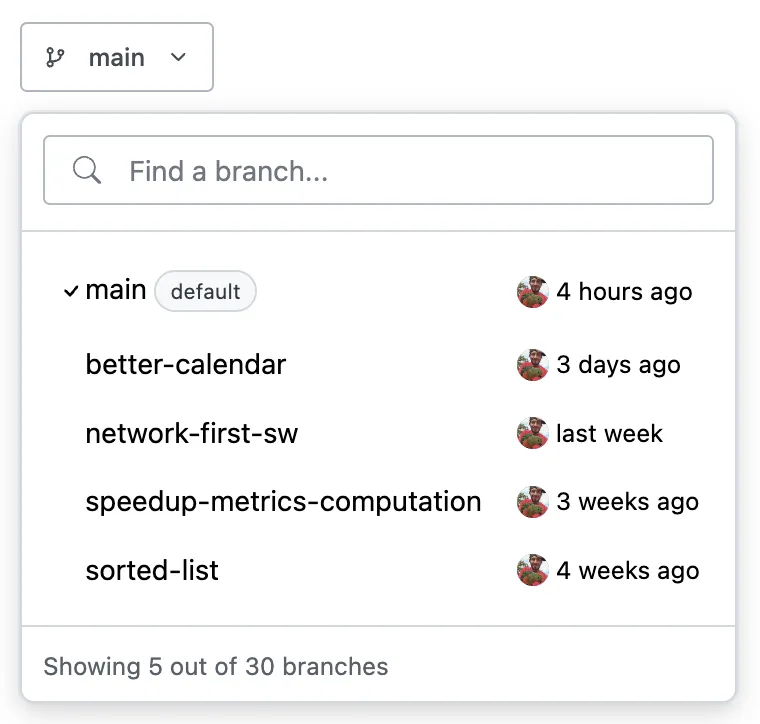
- Branch filter — substring-matching filter over branch names.
- Recent branches — the 5 most recently modified branches that match the filter.
- Last Commit — the branch’s most recent commit, including committer and timestamp.
Environment selector
Section titled “Environment selector”Shows every testing environment by default. You can filter by environment category, or pick a single environment (operating system, browser, or custom environment) to narrow results.
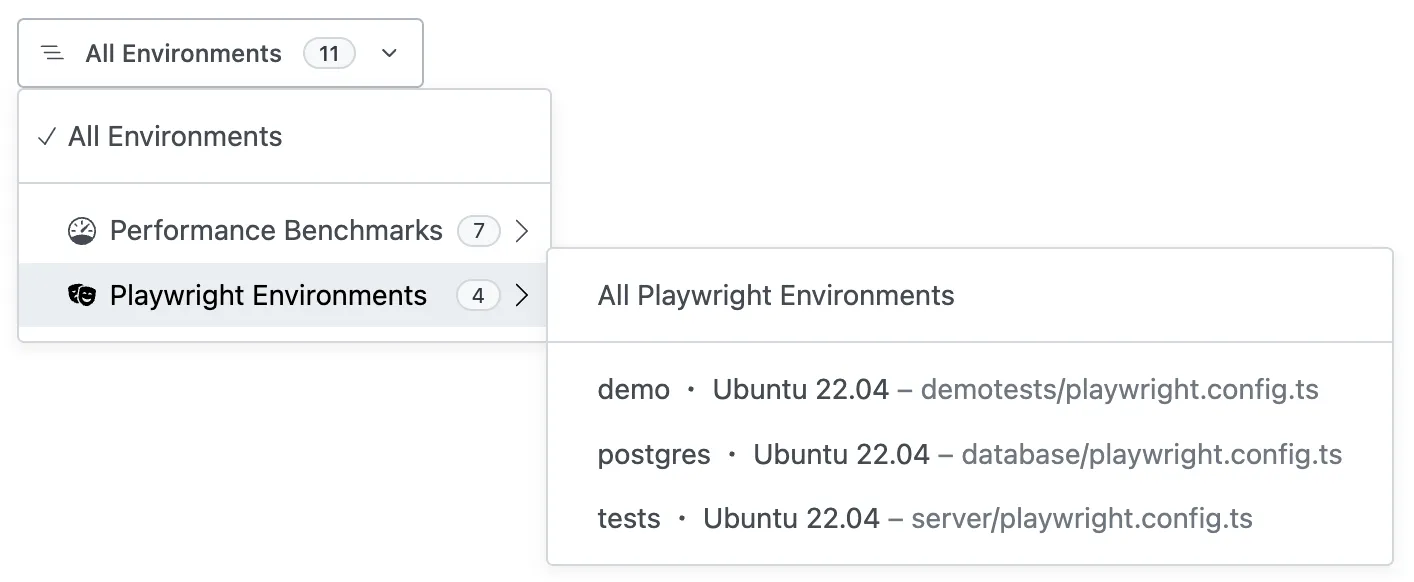
- Categories — environments are grouped by category, usually by test runner. A project with Vitest front-end tests and pytest back-end tests will have two categories here:
vitestandpytest. - Category Environments — every environment inside the selected category.
Test Health Calendar
Section titled “Test Health Calendar”A heat-map of last 3 months. Each cell is one day, coloured by its aggregated status by the end of the day: green (passed), yellow (flaked), red (failed & regressed). Click a cell to jump to that day’s report.
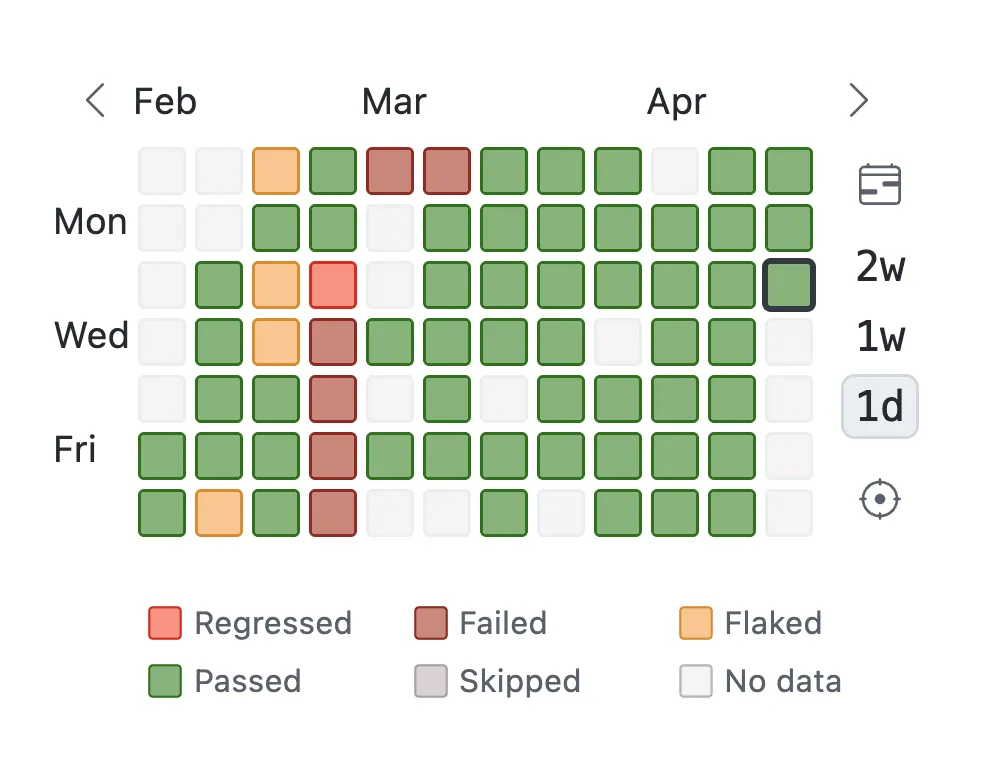
- Calendar view — opens a date picker to jump to any day.
- Range selector — sets the report range. The dashboard shows every test that ran at least once within the range, and each row reports the test’s last result inside the range.
- Last tested — jumps to the most recent day with test activity.
FQL search
Section titled “FQL search”Filters and slices the tests table using Flakiness Query Language (FQL).
Common filters:
click— tests whose name, suite, or file containsclicks:flaked— tests by statusf:login.spec.ts— tests by file name@skip— tests by annotation#smoke— tests by tagduration>1s— tests by last-run durationflip>0%— tests by flip rate$timeout— tests whose error text containstimeout
Status cards
Section titled “Status cards”One card per status: Passed, Regressed, Failed, Flaked, Skipped. Each card shows the count and percentage of tests currently in that state, respecting the active FQL query.
The card block’s background color reflects the day’s aggregated status: green when everything is healthy, yellow when the number of flaked tests exceeds the acceptable flakiness rate, red when anything failed or regressed.
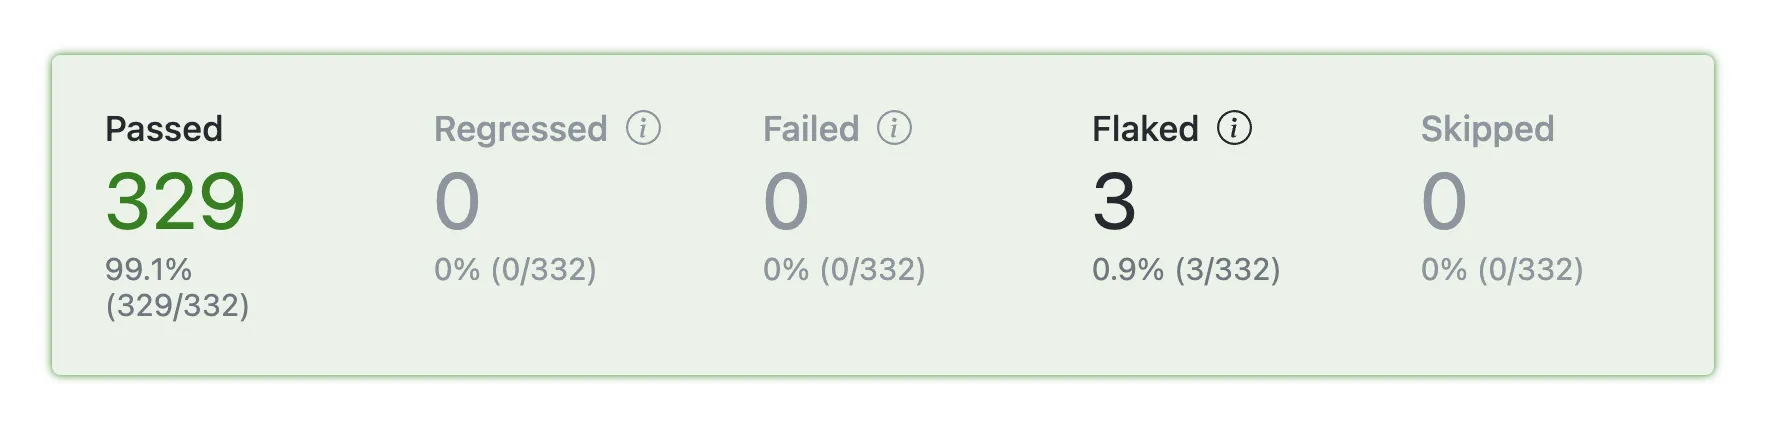
- Passed — tests whose last run of the day is passing.
- Regressed — tests with failing last run of the day that had perfect history before the selected day.
- Failed — tests with failing last run of the day, but had history with flakes or failures before selected day.
- Flaked — tests that flaked during their last run of the day.
- Skipped — tests that were skipped during their last run of the day.
Tests table
Section titled “Tests table”An overview of the filtered set, with one row per test × environment. The same test can appear on multiple rows if it ran in multiple environments — for example, on different operating systems, or, for browser end-to-end tests, in different browsers. Click any column header to sort.
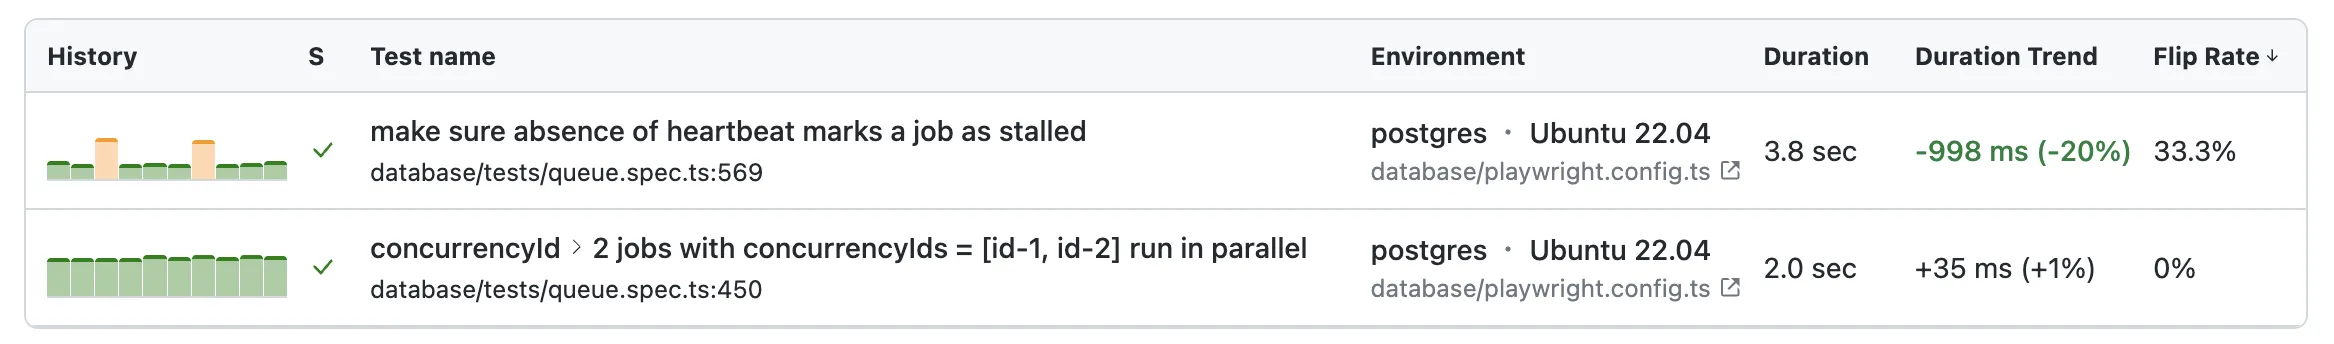
- History — the last 10 commit-executions of this test, one bar per run. The height of the bar is the run’s duration relative to the other runs in the window; the color of the bar is the test outcome in the given commit.
- Status — the test’s last status on the selected day.
- Test name — the full test title and its source location.
- Environment — the environment that produced this row.
- Duration — the last run’s wall-clock time.
- Duration Trend — difference between the first entry in the 10-run history and the current duration.
- Flip Rate — how many times the status flipped across the 10-run history window. See Flip Rate.
Duration Trend and Flip Rate are history-based columns: they summarize the last 10 runs rather than just the selected day.