
History
While the Tests view answers “how healthy is the suite right now?”, the History view answers “how did it get here?”. It shows the selected branch’s commits in reverse chronological order, with test stats attached to every commit that was tested.
Charts
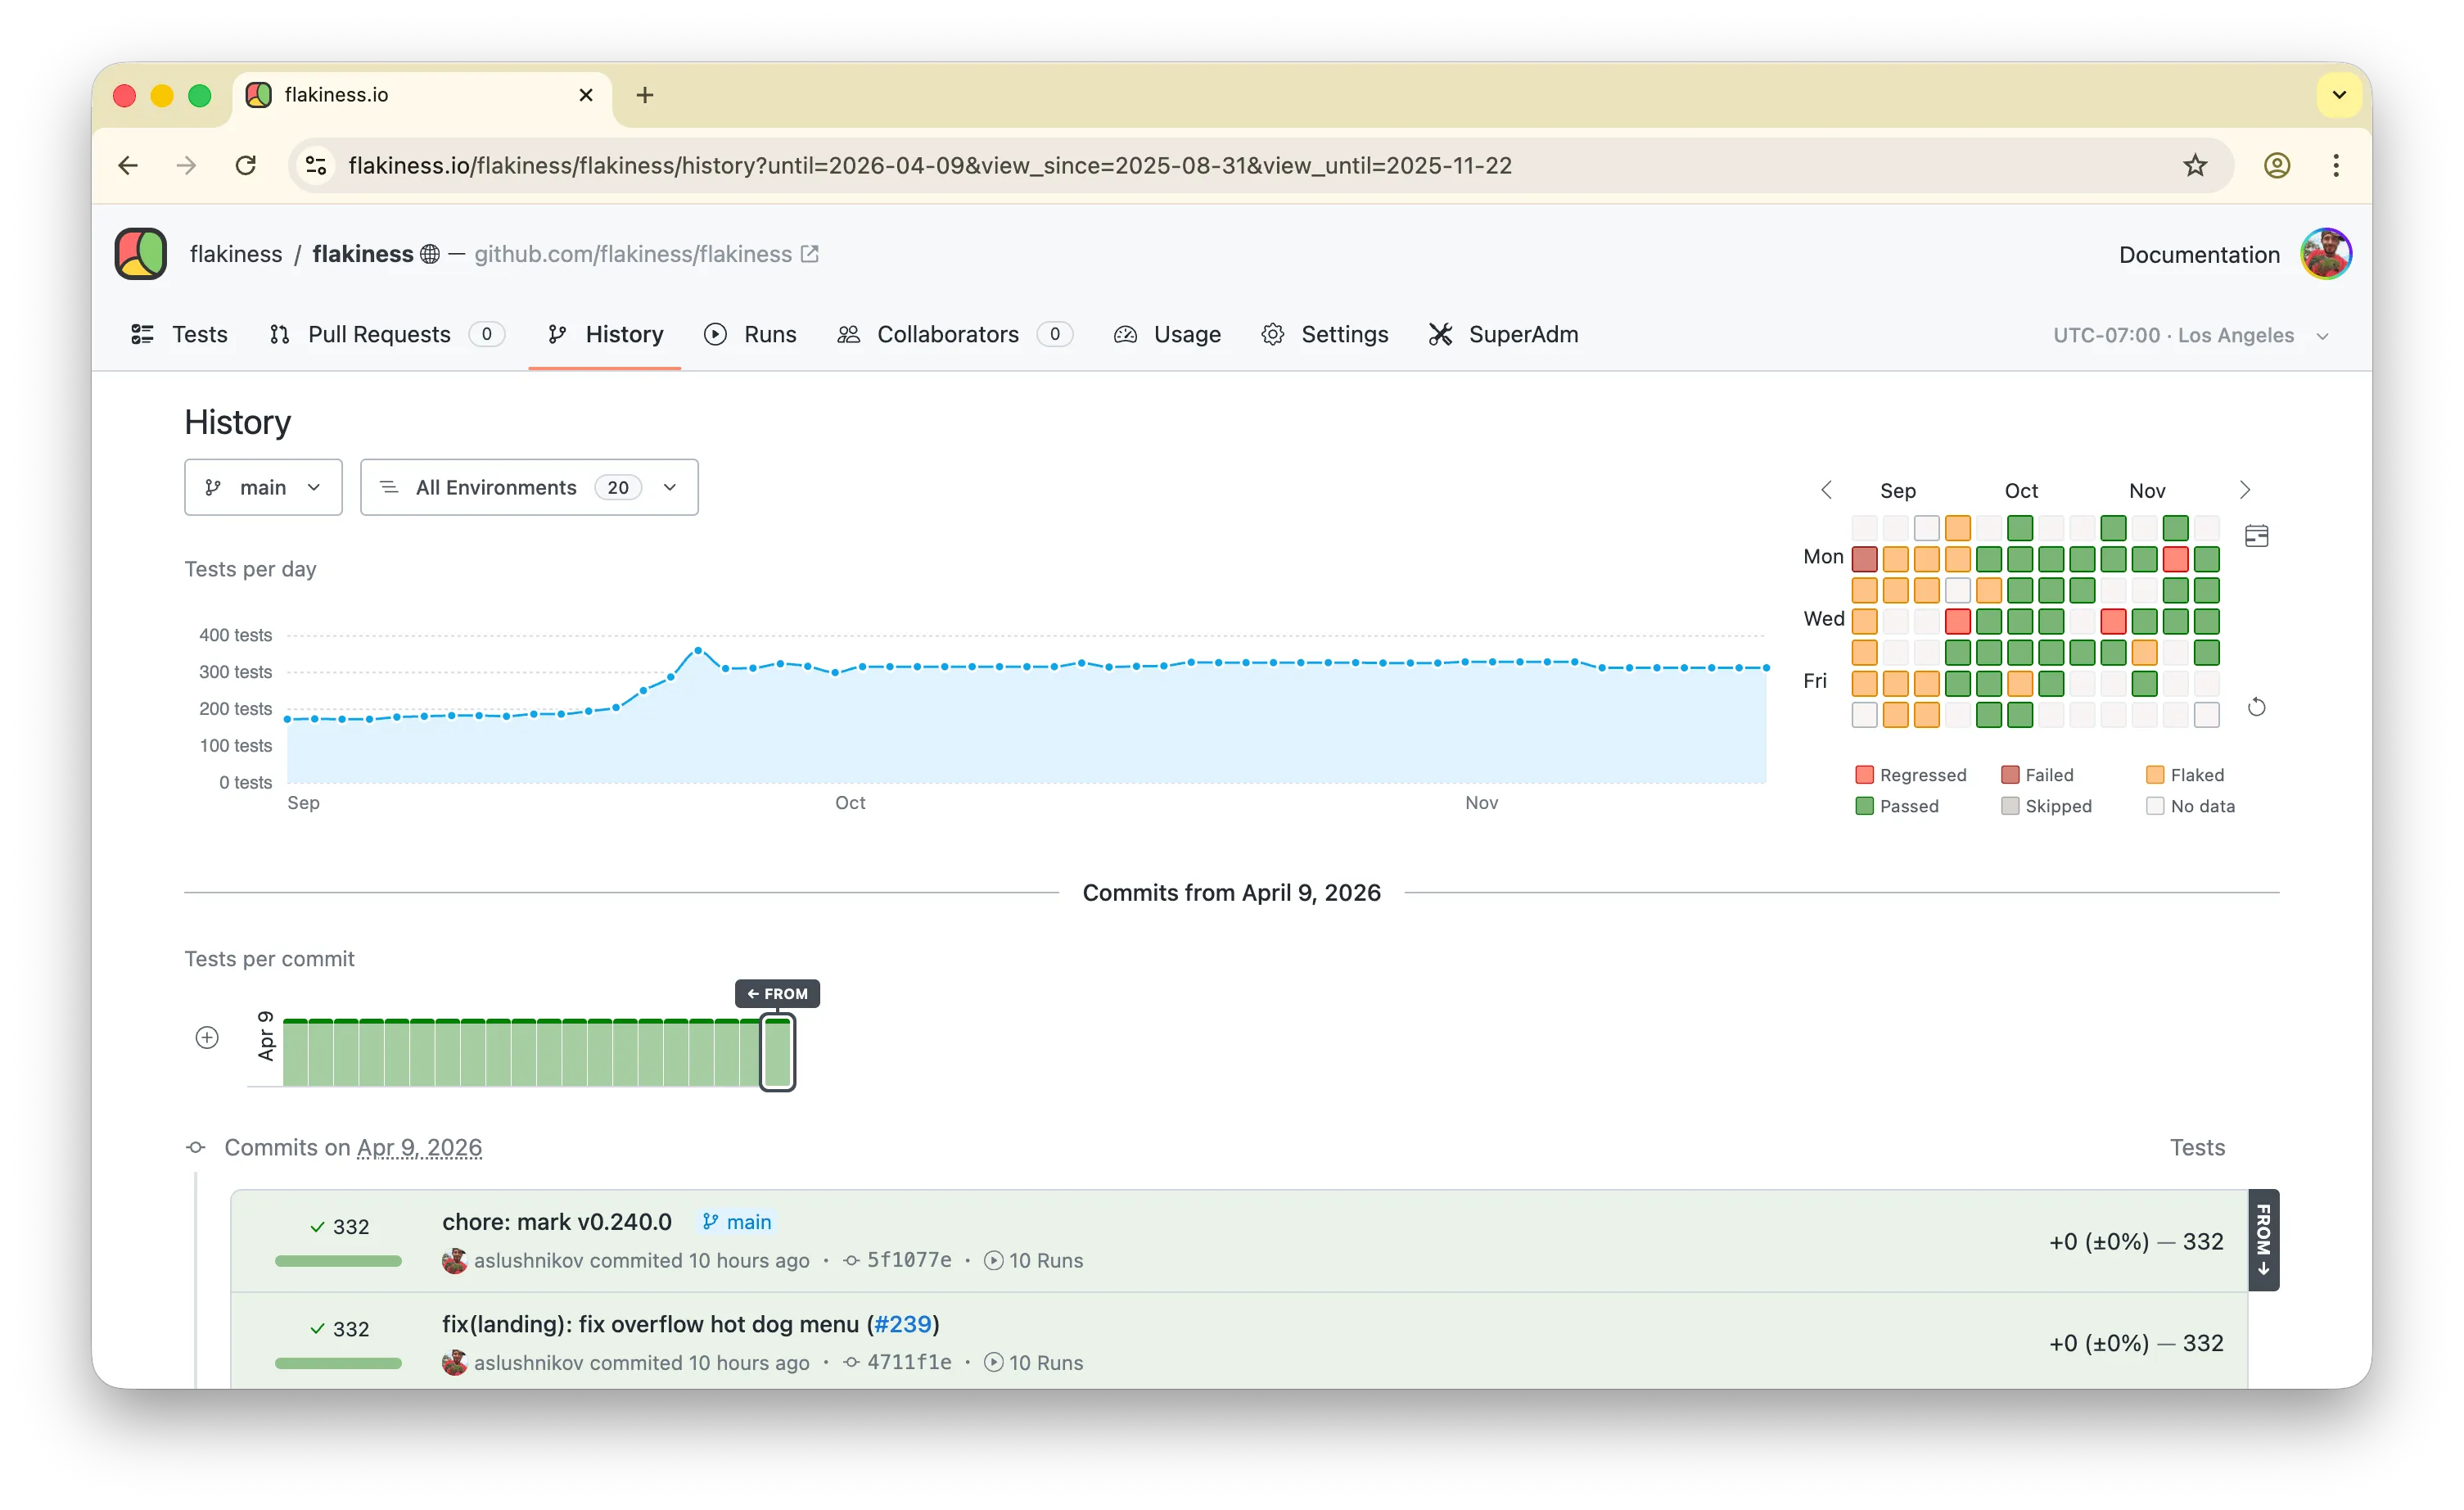
Section titled “Charts”The top of the page summarizes the selected window:
- Tests per day — how many test results were recorded each day.
- Tests per commit — a minimap of the commit feed, one bar per tested commit. Click a bar to jump to that commit in the feed.
Commit feed
Section titled “Commit feed”Commits are grouped by day. Each tested commit shows its aggregated status, the number of recorded test results, and the trend against the previous tested commit, so a sudden jump in test count or duration stands out. Commits stream in as you scroll back in time; collapsed ranges can be expanded in place.
Day headings link to that day’s Tests view, so you can jump from “something changed on this day” straight to the per-test breakdown.
Single-test history
Section titled “Single-test history”The same view powers the history of an individual test. When scoped to a single test, the charts switch from test counts to the test’s duration, making duration regressions visible across commits and days.