
Single Run
Opening a run — from the Runs view, from a commit, or from the upload confirmation link in your CI logs — shows the full report for that single upload: every test’s result with errors and artifacts, plus the execution waterfall and system telemetry when the reporter captured them.

Certain test runners expose information about test execution details, like which parallel worker executed the test, when it started and how long did it take. In addition, certain reporters embed system telemetry to overlay the test execution.
Tests Waterfall
Section titled “Tests Waterfall”The lower section shows one horizontal lane per parallel worker (thread/process). Each test appears as a colored bar:
| Color | Meaning |
|---|---|
| Green | Test passed |
| Red | Test failed |
| Gray | Test was skipped |
The bar’s width represents the test’s duration. Gaps between bars show idle time on that worker. This makes it easy to spot:
- Uneven distribution — one worker doing most of the work while others sit idle
- Long-running tests — single tests that dominate the timeline
- Bottlenecks — workers waiting because a slow test is blocking
Hover over a test bar to see its name, outcome, and retry number. Click a test bar to navigate to that test’s detailed results; other tests are dimmed to highlight the selection.
System Telemetry
Section titled “System Telemetry”When available, the upper section overlays CPU and memory usage synchronized with the test execution timeline, helping you correlate test failures with resource pressure.
- CPU — average load across all CPU cores, rendered with an orange-to-red gradient fill
- Memory — rendered with a blue-to-purple gradient fill
Hover over any point to see the exact CPU percentage and memory usage (both as a percentage and in absolute bytes, e.g. “2.4 GB (54%)”) at that moment in the test run.
Telemetry depends on the test runner reporter. For example, @flakiness/playwright captures CPU and
memory telemetry automatically, while @flakiness/pytest-flakiness does not.
If no telemetry data is present in the report, the telemetry section is simply not shown.
Errors
Section titled “Errors”When tests fail, the Test Report shows error details with full context. Each failed test shows its errors inline. An error includes:
- Error message — the assertion or exception message
- Stack trace — the full call stack with ANSI colors preserved from the terminal
- Code snippet — when the reporter embeds source files, the viewer shows the relevant lines of code around the failure location
Errors Tab
Section titled “Errors Tab”Test Report includes an Errors tab that aggregates all unique errors across the report into a summary table.
The table sorts by impacted test count (most common errors first), making it easy to identify systemic issues — like a shared service being down or a common assertion pattern failing across many tests.
Clicking an error filters the report to show only tests with that specific error.
Filtering by Error
Section titled “Filtering by Error”Use FQL to search for tests by error text:
$timeout # tests with "timeout" in the error$undefined # tests with "undefined" in the error$"connection refused" f:api # connection errors in API test filesMultiple Errors Per Test
Section titled “Multiple Errors Per Test”A single test can produce multiple errors — for example, when using soft assertions that continue execution after a failure. Test Report displays all errors for the test, not just the first one.
Infrastructure errors that occur outside of a specific test (e.g., during setup or teardown) are shown separately at the Test Report header.
Artifacts
Section titled “Artifacts”Test reporters capture files produced during test execution — screenshots, videos, trace files, HTML snapshots, terminal output, and any other artifacts — and include them in the Flakiness report. The Report Viewer displays these inline alongside test results.
Storage and quotas
Section titled “Storage and quotas”Every uploaded artifact counts toward your organization’s storage quota, which is defined by the active organization plan. Once the quota is full, new uploads to any project in the organization will fail until storage is freed or the plan is upgraded.
Flakiness reporters auto-compress compressible artifacts before upload to save storage, and all artifacts are encrypted at rest.
The Flakiness JSON report itself is stored as an artifact, so the report’s own data also contributes to the quota. On average, 1 GB fits about 13 million test results.
Attribution to test steps
Section titled “Attribution to test steps”Where the test runner exposes step information (for example, Playwright Test’s test.step or
built-in action steps), attachments are attributed to the step that produced them rather
than the test as a whole. Failure context becomes much easier to scan: the screenshot taken
right before an assertion failed sits next to the assertion, not at the bottom of the run.
For runners that don’t emit step events, attachments are attached to the test.
Attachment Types
Section titled “Attachment Types”Flakiness.io supports several attachment types natively.
HTML attachments render inside a sandboxed <iframe> in the Report Viewer, so you can
inspect the exact markup produced at test time. This is useful for DOM snapshots,
rendered email templates, or any other HTML artifact the test captured.
Images are displayed inline with the test result. When multiple images are present, they are laid out in a flex-wrapped gallery.
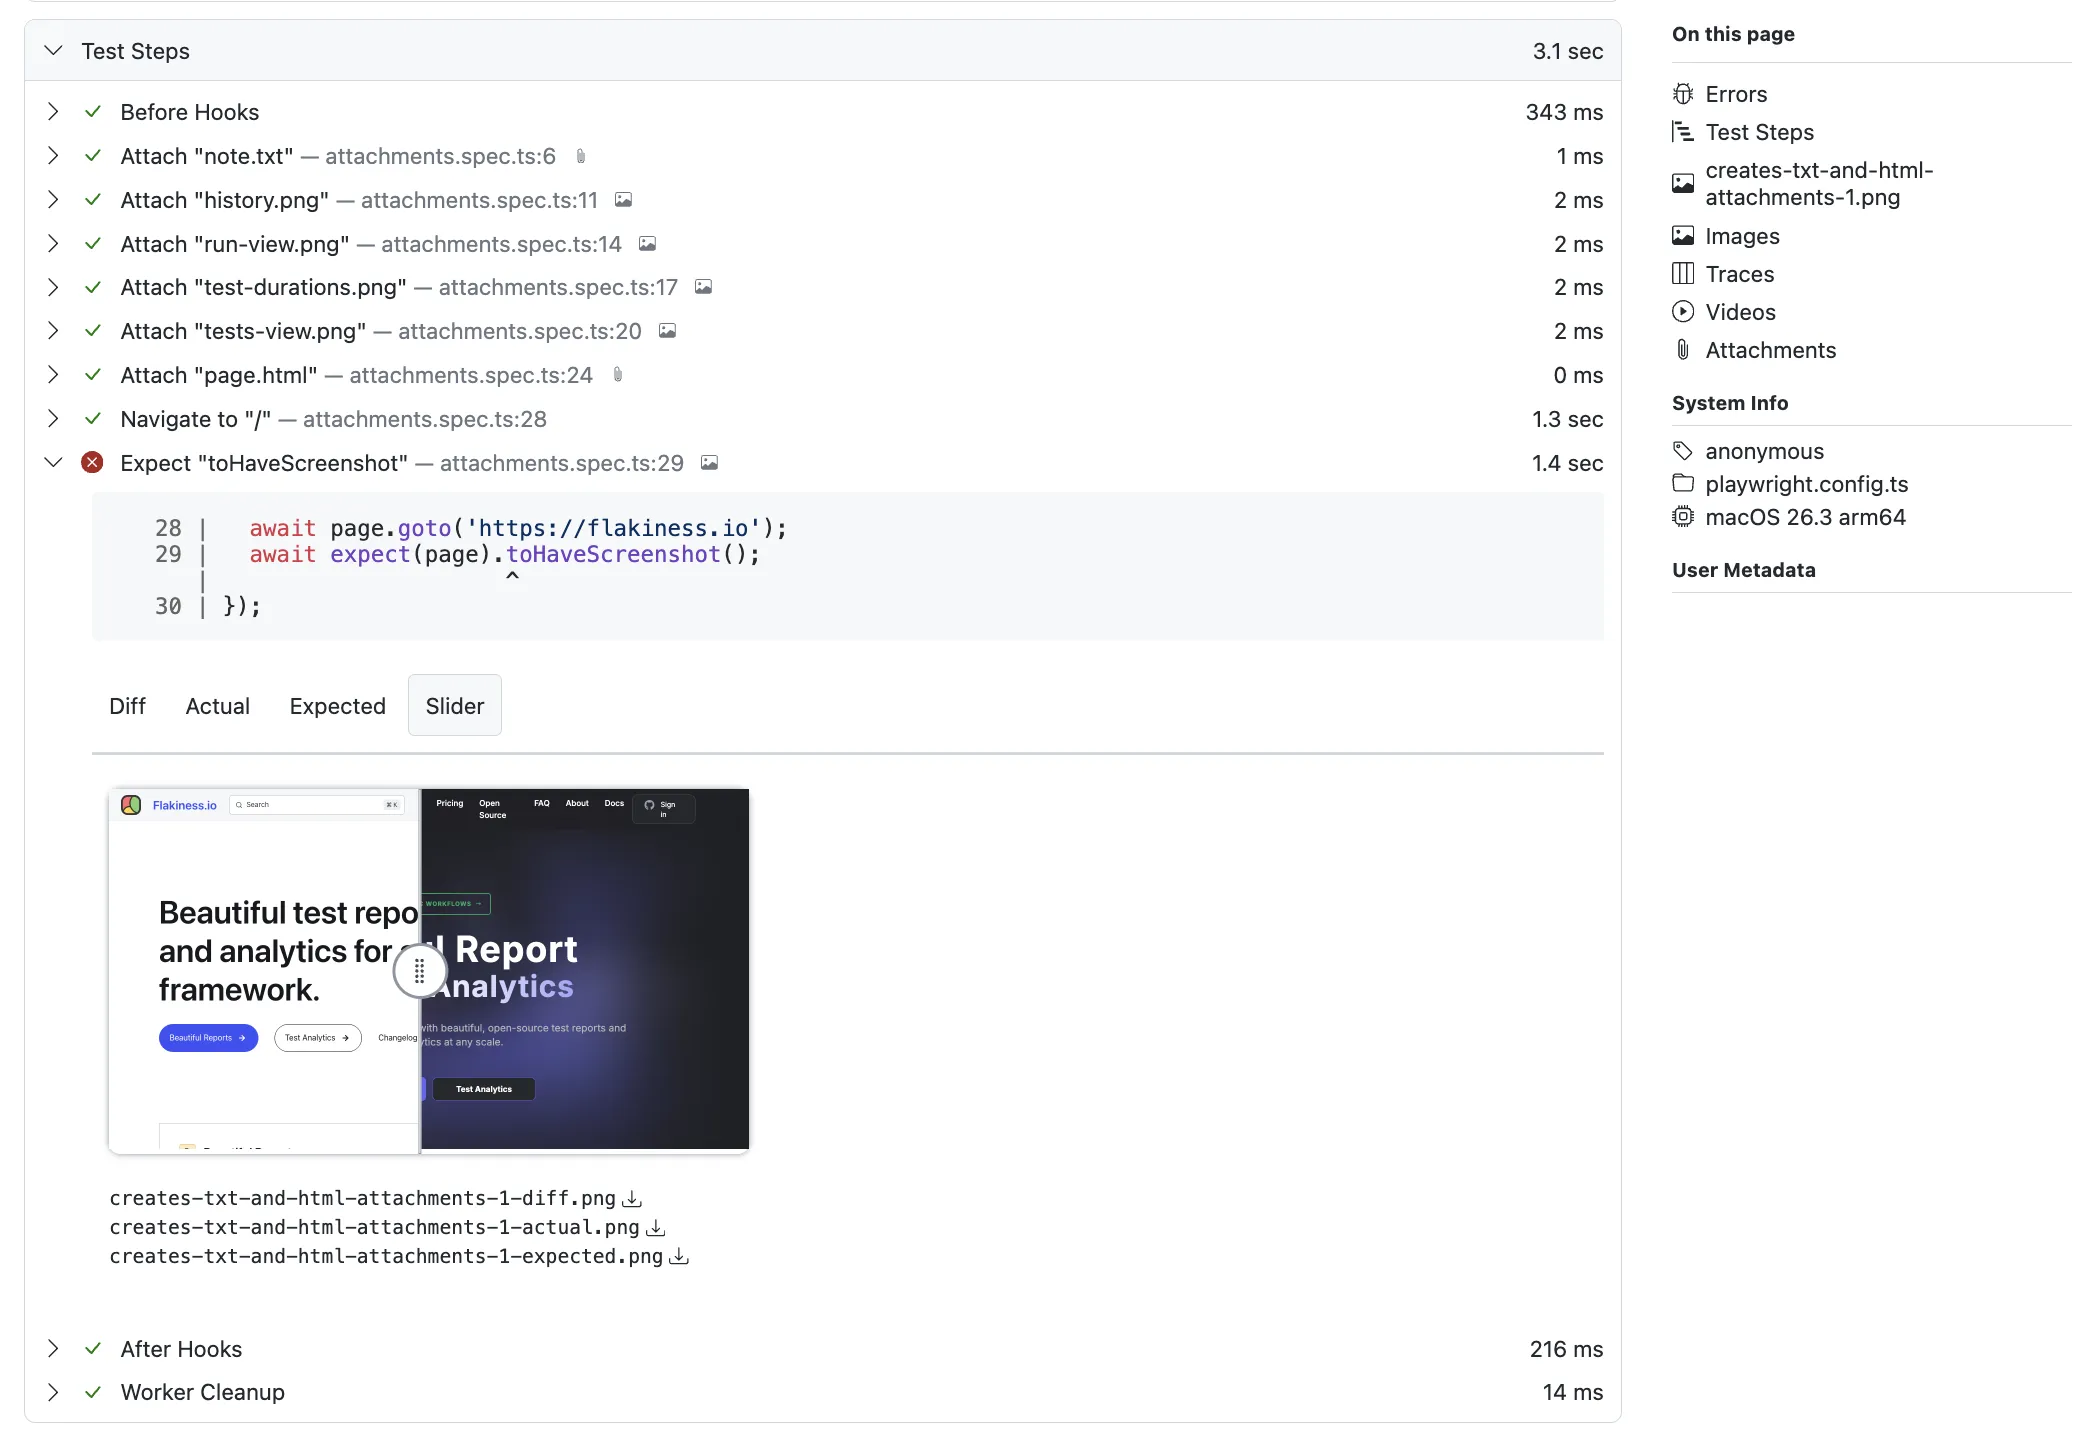
Image Diffs
Section titled “Image Diffs”When a visual comparison test fails, reporters typically produce three images: expected,
actual, and diff. The Report Viewer auto-detects these by naming convention
(name-expected.png, name-actual.png, name-diff.png) and presents them in a tabbed
interface with four views:
- Diff — the computed difference image
- Actual — what the test produced
- Expected — the baseline reference
- Slider — an interactive image comparer that lets you drag between actual and expected
Video attachments render as inline <video> elements with playback controls.
Playwright Trace
Section titled “Playwright Trace”Playwright traces receive special treatment.
When the @flakiness/playwright reporter captures a trace file, the Report Viewer displays
it with a dedicated thumbnail and a link that opens the trace in the
Playwright Trace Viewer, which gives you a full timeline of
actions, network requests, DOM snapshots, and console logs for that test.
Traces are automatically detected when an attachment has the name trace.
Terminal Logs
Section titled “Terminal Logs”Reporters capture stdout and stderr output during test execution. Each test run shows its terminal output in a dedicated section with log entries displayed in chronological order.
Stderr entries are highlighted with a red background to make them visually distinct.
ANSI escape sequences are rendered as styled text, so colors, bold, and other formatting match what you’d see in your terminal.
Miscellaneous Files
Section titled “Miscellaneous Files”Any other attachment type (logs, JSON files, data exports) is shown as a downloadable link.