
Tests
The Tests view is the dashboard’s landing page: every test’s state for the selected day (or range), summarized in status cards and listed in the tests table. The branch, environment, calendar, and FQL controls scope what you see.
Status cards
Section titled “Status cards”One card per status: Passed, Regressed, Failed, Flaked, Skipped. Each card shows the count and percentage of tests currently in that state, respecting the active FQL query.
The card block’s background color reflects the day’s aggregated status: green when everything is healthy, yellow when the number of flaked tests exceeds the acceptable flakiness rate, red when anything failed or regressed.
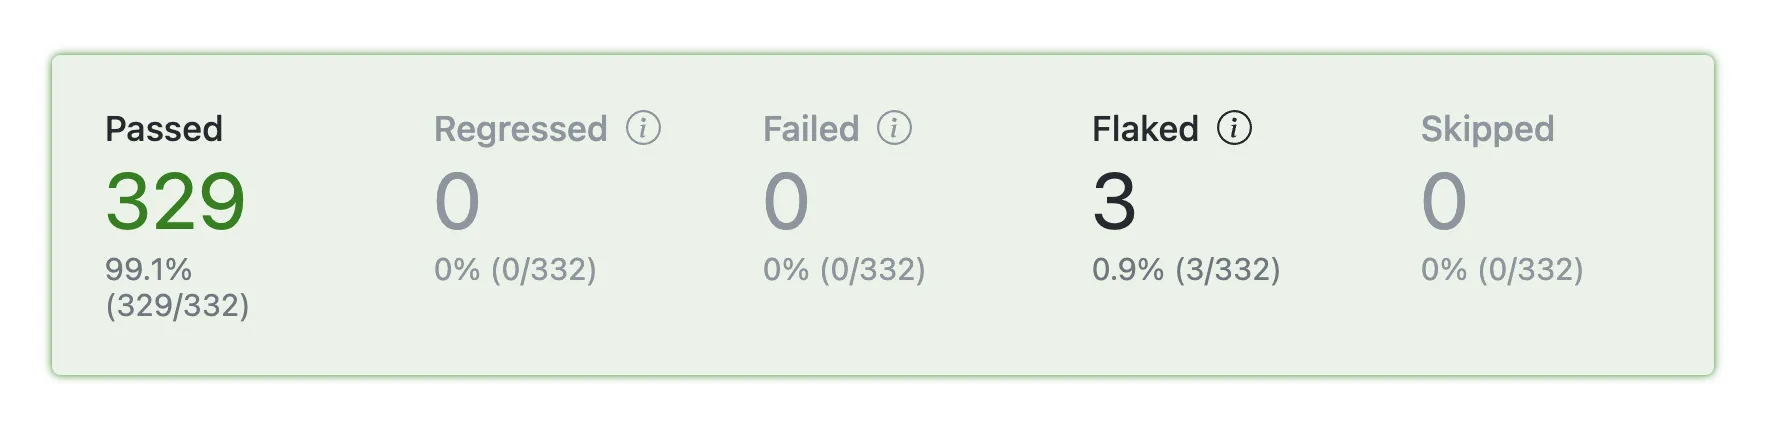
- Passed — tests whose last run of the day is passing.
- Regressed — tests with failing last run of the day that had perfect history before the selected day.
- Failed — tests with failing last run of the day, but had history with flakes or failures before selected day.
- Flaked — tests that flaked during their last run of the day.
- Skipped — tests that were skipped during their last run of the day.
Tests table
Section titled “Tests table”An overview of the filtered set, with one row per test × environment. The same test can appear on multiple rows if it ran in multiple environments — for example, on different operating systems, or, for browser end-to-end tests, in different browsers. Click any column header to sort.
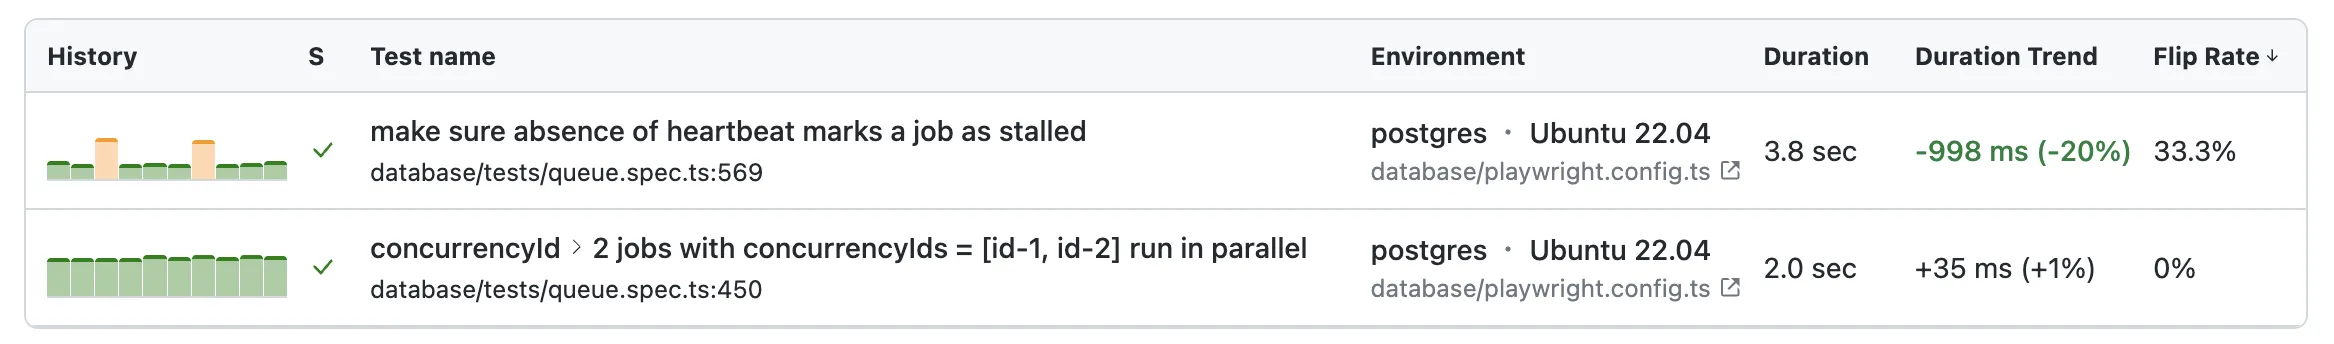
- History — the last 10 commit-executions of this test, one bar per run. The height of the bar is the run’s duration relative to the other runs in the window; the color of the bar is the test outcome in the given commit.
- Status — the test’s last status on the selected day.
- Test name — the full test title and its source location.
- Environment — the environment that produced this row.
- Duration — the last run’s wall-clock time.
- Duration Trend — difference between the first entry in the 10-run history and the current duration.
- Flip Rate — how many times the status flipped across the 10-run history window. See Flip Rate.
Duration Trend and Flip Rate are history-based columns: they summarize the last 10 runs rather than just the selected day.